![]()
Why Is Data Visualisation So Important for Modern Businesses?
As far as the modern world goes, data is a remarkable business tool. It allows organisations to identify patterns and make better decisions as well as promote growth and success. However, even if your business is drowning in data, it’s useless if you have no way of analysing it.
These days, businesses of all sizes are gathering increasing amounts of data. The problem is when it comes to understanding it, you need a way to analyse data otherwise your efforts are pretty much useless. As a result, businesses all over the world are clamouring for a system that can analyse all of their data and make it easier to understand. This is where data visualisation really shines.
So what is data visualisation? And why is it so important for modern businesses?
What is data visualisation?
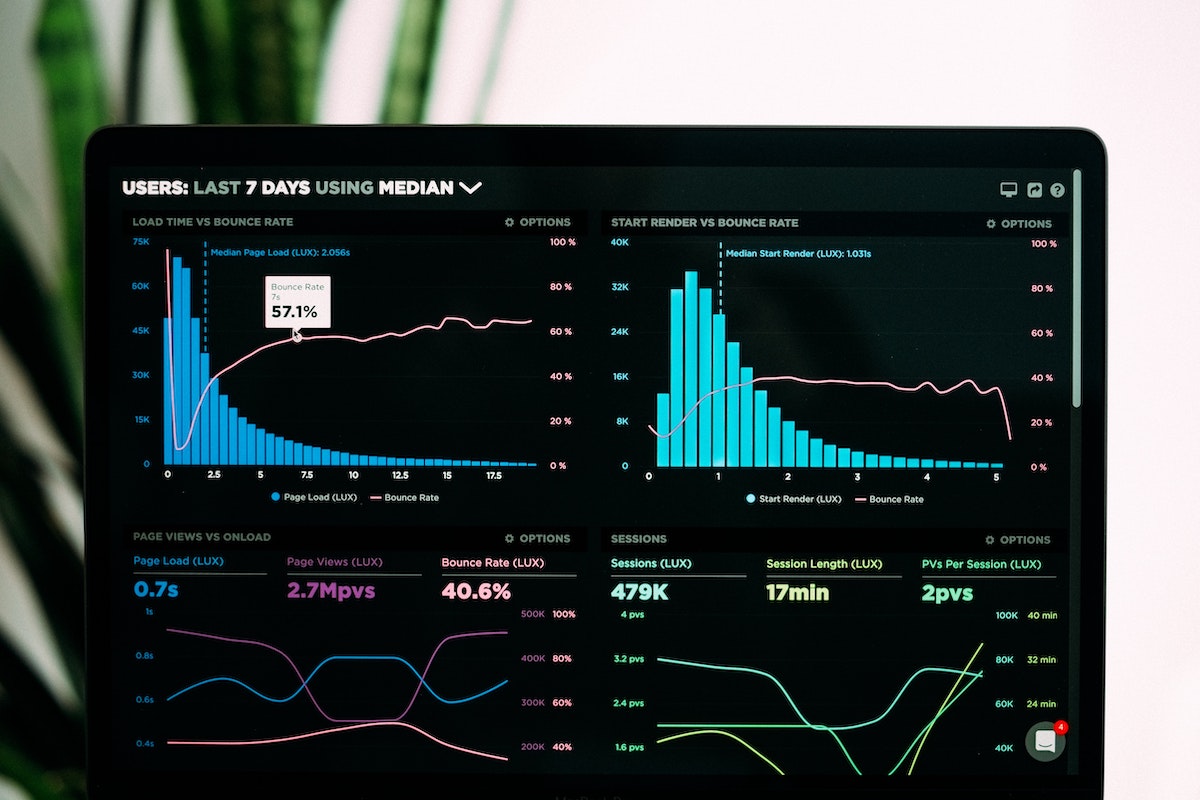
When it comes to implementing business intelligence and analytics solutions in your day-to-day operations, data visualisation is one of the crucial services to consider. This is because the process allows large and small businesses alike to visualise complex data sets in a visual format, which is easier to interpret and understand than a spreadsheet or text file.
Essentially, by presenting data in a graph or chart, businesses can uncover trends, patterns and powerful insights that statistics alone may not readily disclose. High quality, forward-thinking data visualisation is storytelling. The process highlights outliers and trends by transforming raw data into a form that is easier to analyse and draw conclusions from. It also plays an important role in removing any noise or distractions.
Of course, effective data visualisation can be a tricky balancing act between functionality and ensuring the visuals are aesthetically immersive and engaging. The most eye-catching visualisation could entirely fall short of what it needs to do, while the simplest graph might be too dull to hold anyone’s interest but still make a highlight a crucial insight. To successfully combine data analysis with storytelling, the facts and data must mesh with the visual elements.
The benefits of data visualisation
When it comes to data visualisation, there are several advantages to take into account. Perhaps most important, modern data visualisation suites can help your business make well-informed, data-driven decisions that pave the path to a more strategic future. Doing so can also highlight areas within your organisation that require attention and as a result, can give you the opportunity to boost productivity and efficiency in your daily operations.
Furthermore, by giving your workforce access to innovative data visualisation tools such as Microsoft Power BI, you’ll give your entire company the capabilities it needs rather than just a select group of employees or specific department. As a result, your staff will be able to rapidly access the data they require when they need it – whether they’re working remotely or in a centralised office. This reduces the risk of an employee making an uninformed judgement and makes it easier for your business to make smarter decisions informed by real data – not opinions.
Other benefits of data visualisation include the ability to discover opportunities in emerging markets, improve customer interactions and the end user experience and learn more about behaviour of your target audience. In addition, you can also quicken response times, acquire real-time access to vital data and information, improve management within your organisation and gain visibility of daily business processes, as well as communicate new business prospects and initiatives to key stakeholders.
Why is data visualisation important?
So can your business benefit from implementing data visualisation? The answer is a resounding yes. At the end of the day, making data simpler to interpret is advantageous for all businesses – regardless of size, age or market niche. This is due to the fact that patterns may be recognised and understood more effectively through the use of graphics or pictures. As a result, visualisation tools and technologies are crucial for the analysis of vast volumes of data as well as ensuring your organisation is making reasoned, data-driven judgments.
Data visualisation has many advantages, including making it easier to comprehend how actions and results relate to one another, which can help an organisation make informed, data-driven decisions. Large and small business alike can also identify industry trends and changes as well as developing patterns by using data visualisation tools like Microsoft Power BI. By merely providing a visual context, data visualisation can also help organisations understand the significance of the data by utilising visually immersive maps, charts and graphs. It’s contribution to the data analytics industry should not be overlooked.
Final thoughts
Data visualisation is the act of presenting data in an engaging visual framework with the goal of making it simpler to interpret. Charts and graphs are powerful visual representations that may be created in business ppt presentations which are essential for providing effective communication and information. It serves as a useful tool for identifying outliers in huge data sets as well as tracking patterns and new trends. So how will data visualisation benefit your business?
Businesses of all kinds are collecting an increasing amount of data these days. The issue is that you need a mechanism to analyse data in order to understand it. As a result, businesses everywhere are clamouring for a system that can analyse all of their data and make it simpler to grasp. This is where the process of data visualisation really shines.
The fundamental tenet of data visualisation is that thorough analysis can only be performed once conclusions have been reached from data that has been visually displayed. By providing data with a visual context, visualisation solutions like Microsoft Power BI allow both small and large organisations alike to understand and interpret data easily – without the need for vast spreadsheets or text. This can aid in putting data-driven initiatives and campaigns into action and help to direct strategic decision-making.